WazeVisual
Designing a data visualization platform for traffic density
USER INTERFACE | USER EXPERIENCE | DATA VISUALIZATION
GOAL
Develop a tool utilizing data from the WAZE app's Connected Citizens program to assist users in strategic infrastructure planning for the Ministry of Public Works and Transportation in Costa Rica.
MY ROLE
UX Designer
Qualitative interviews, Information Architecture, Wireframes, Low and high-fidelity prototyping, Usability testing
TOOLS
Adobe Illustrator, Invision, SQL, Javascript
Starting point
Costa Rica is a small country with a serious traffic problem. Drivers spend around 15 days each year in traffic, and congestion has increased by 1500% over the past 30 years.
There is traffic data available. Waze is a GPS navigation app that offers real-time updates on location, speed, and accidents in Costa Rica, it is a popular app with over 400,000 users in a country of 5 million. Its high engagement level allows it to participate in the Connected Citizens initiative, which shares traffic data safely with the government to help address traffic issues.
Emphasizing with users

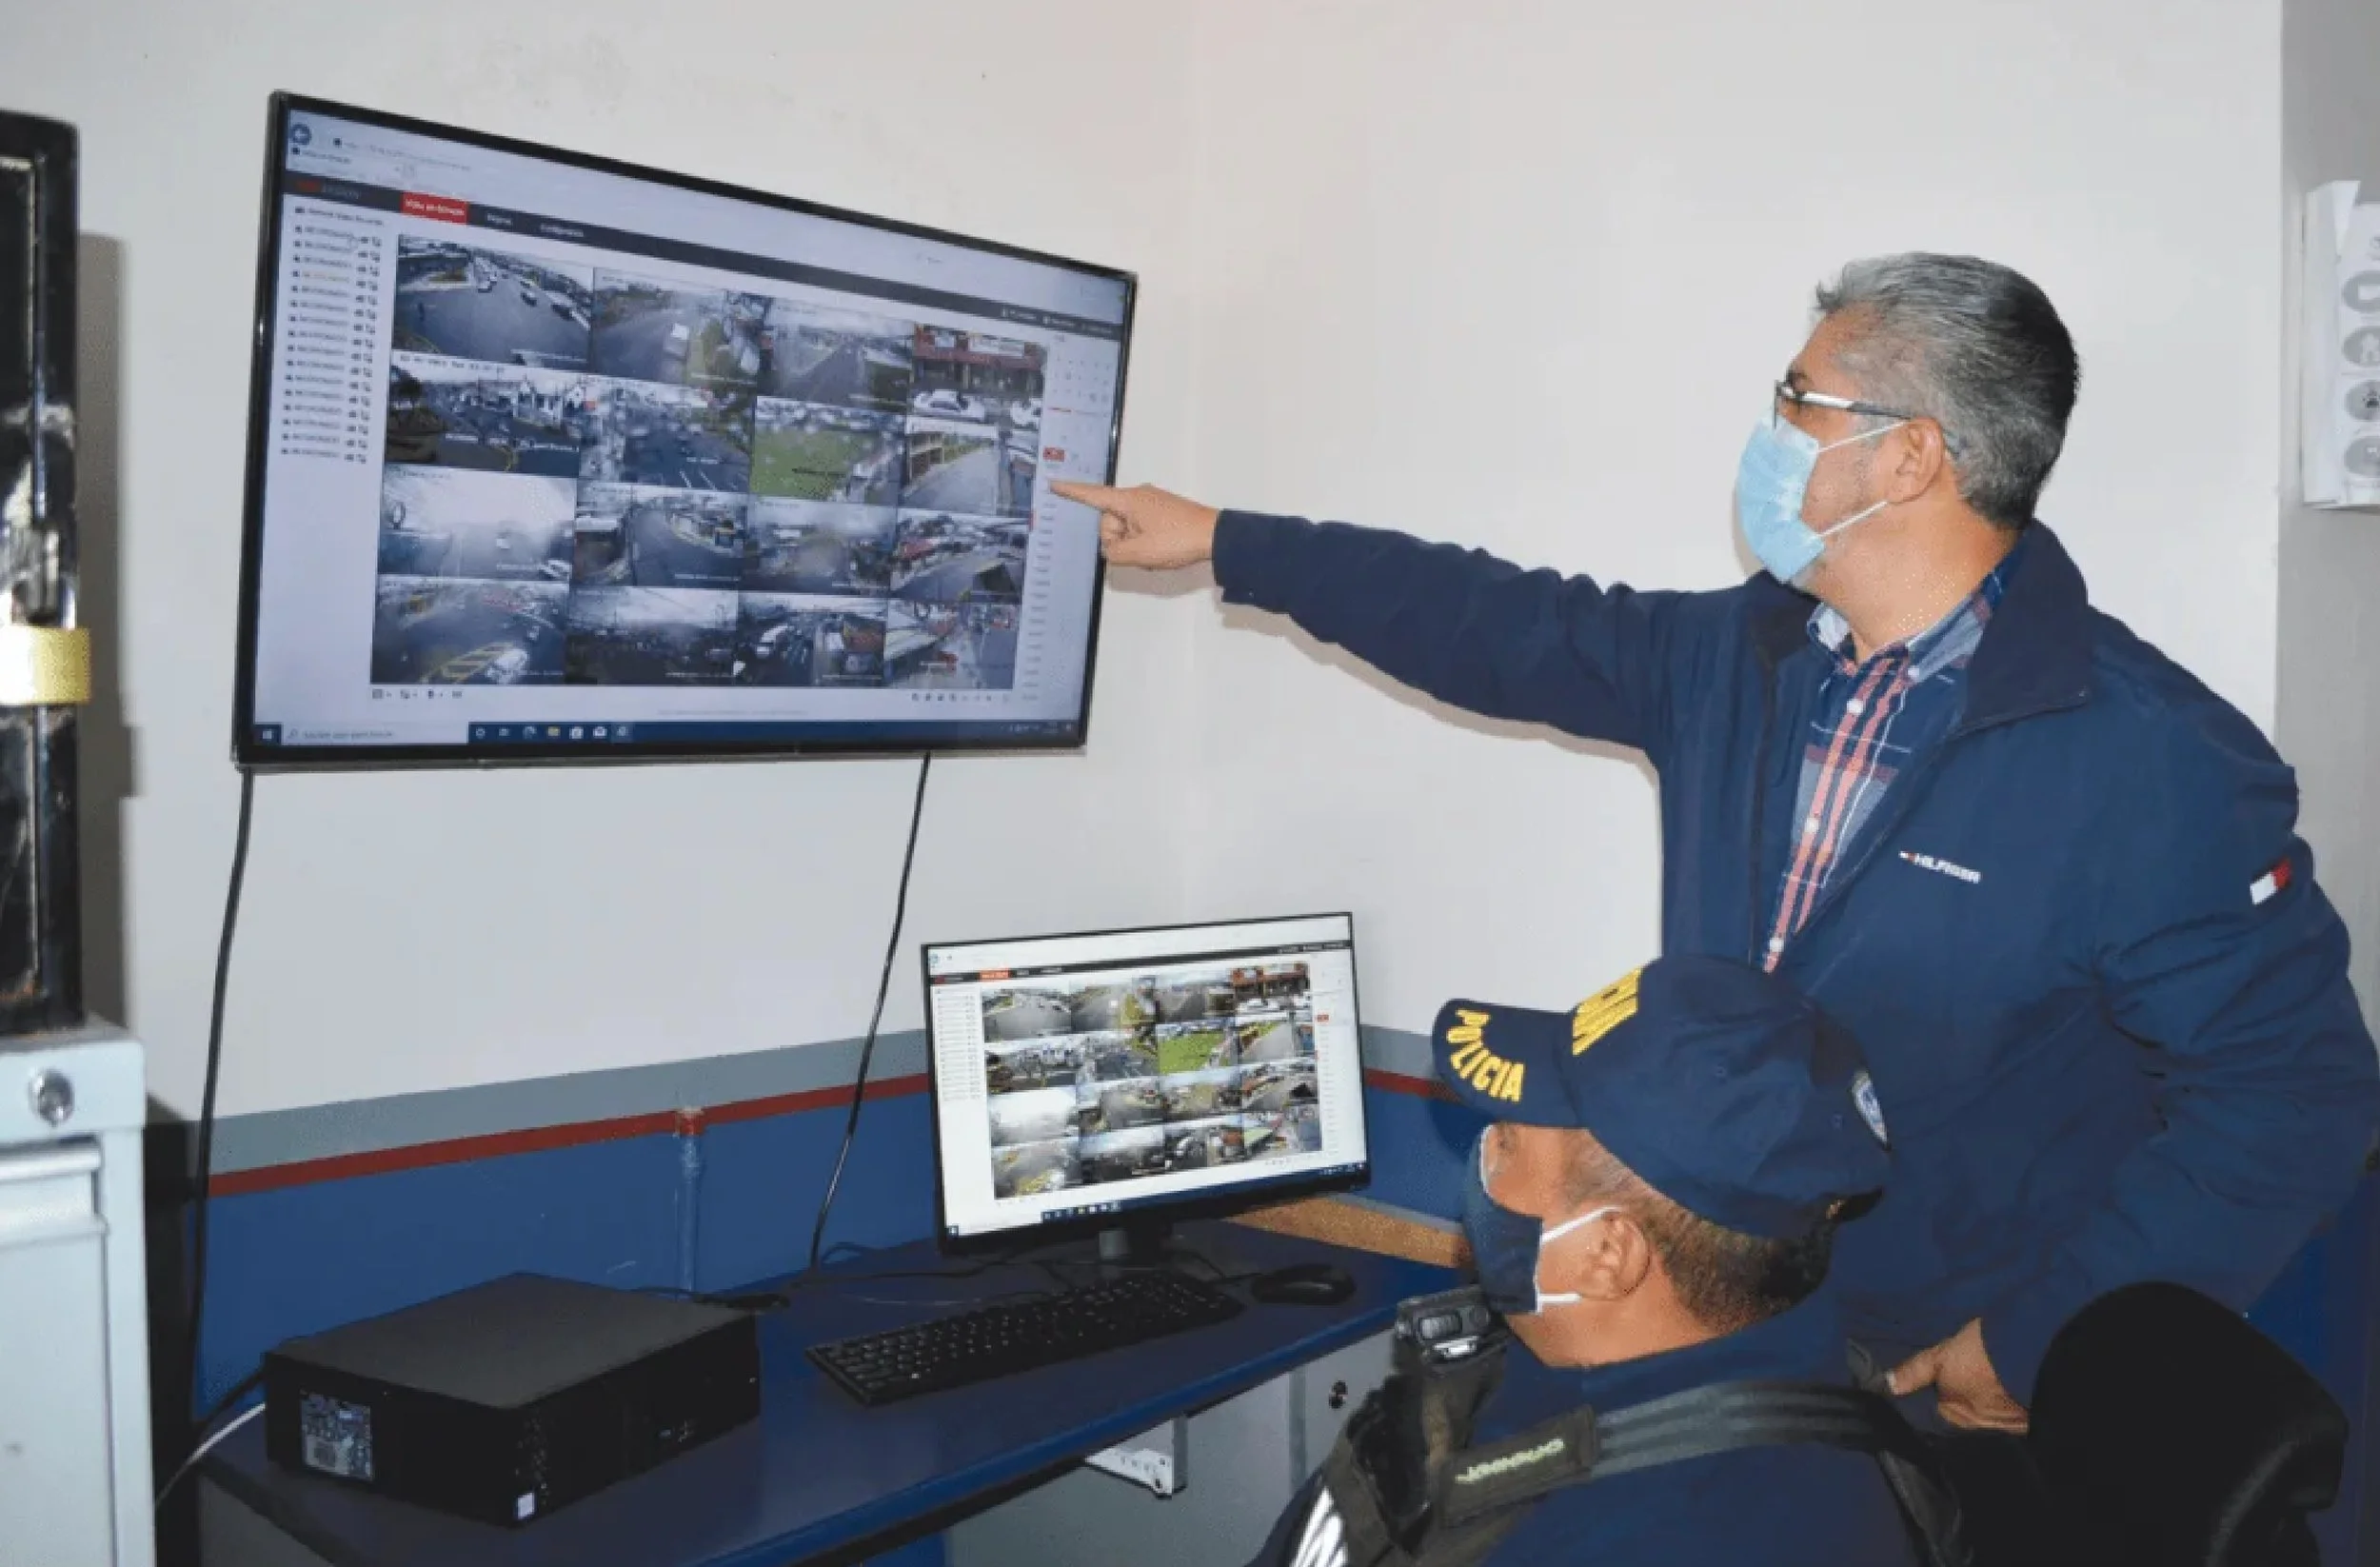
We conducted interviews to understand the primary needs of potential workers in the Department of Sectorial Planning and the General Department of Transit Police.
So, what do our users need? A tool that supports strategic infrastructure planning through adequate access to historical traffic data. This capability will enable them to:
1
Prioritize infrastructure improvements
Exploration
2
Identify the best locations and times for officers to be present.
How could we visualize the data?
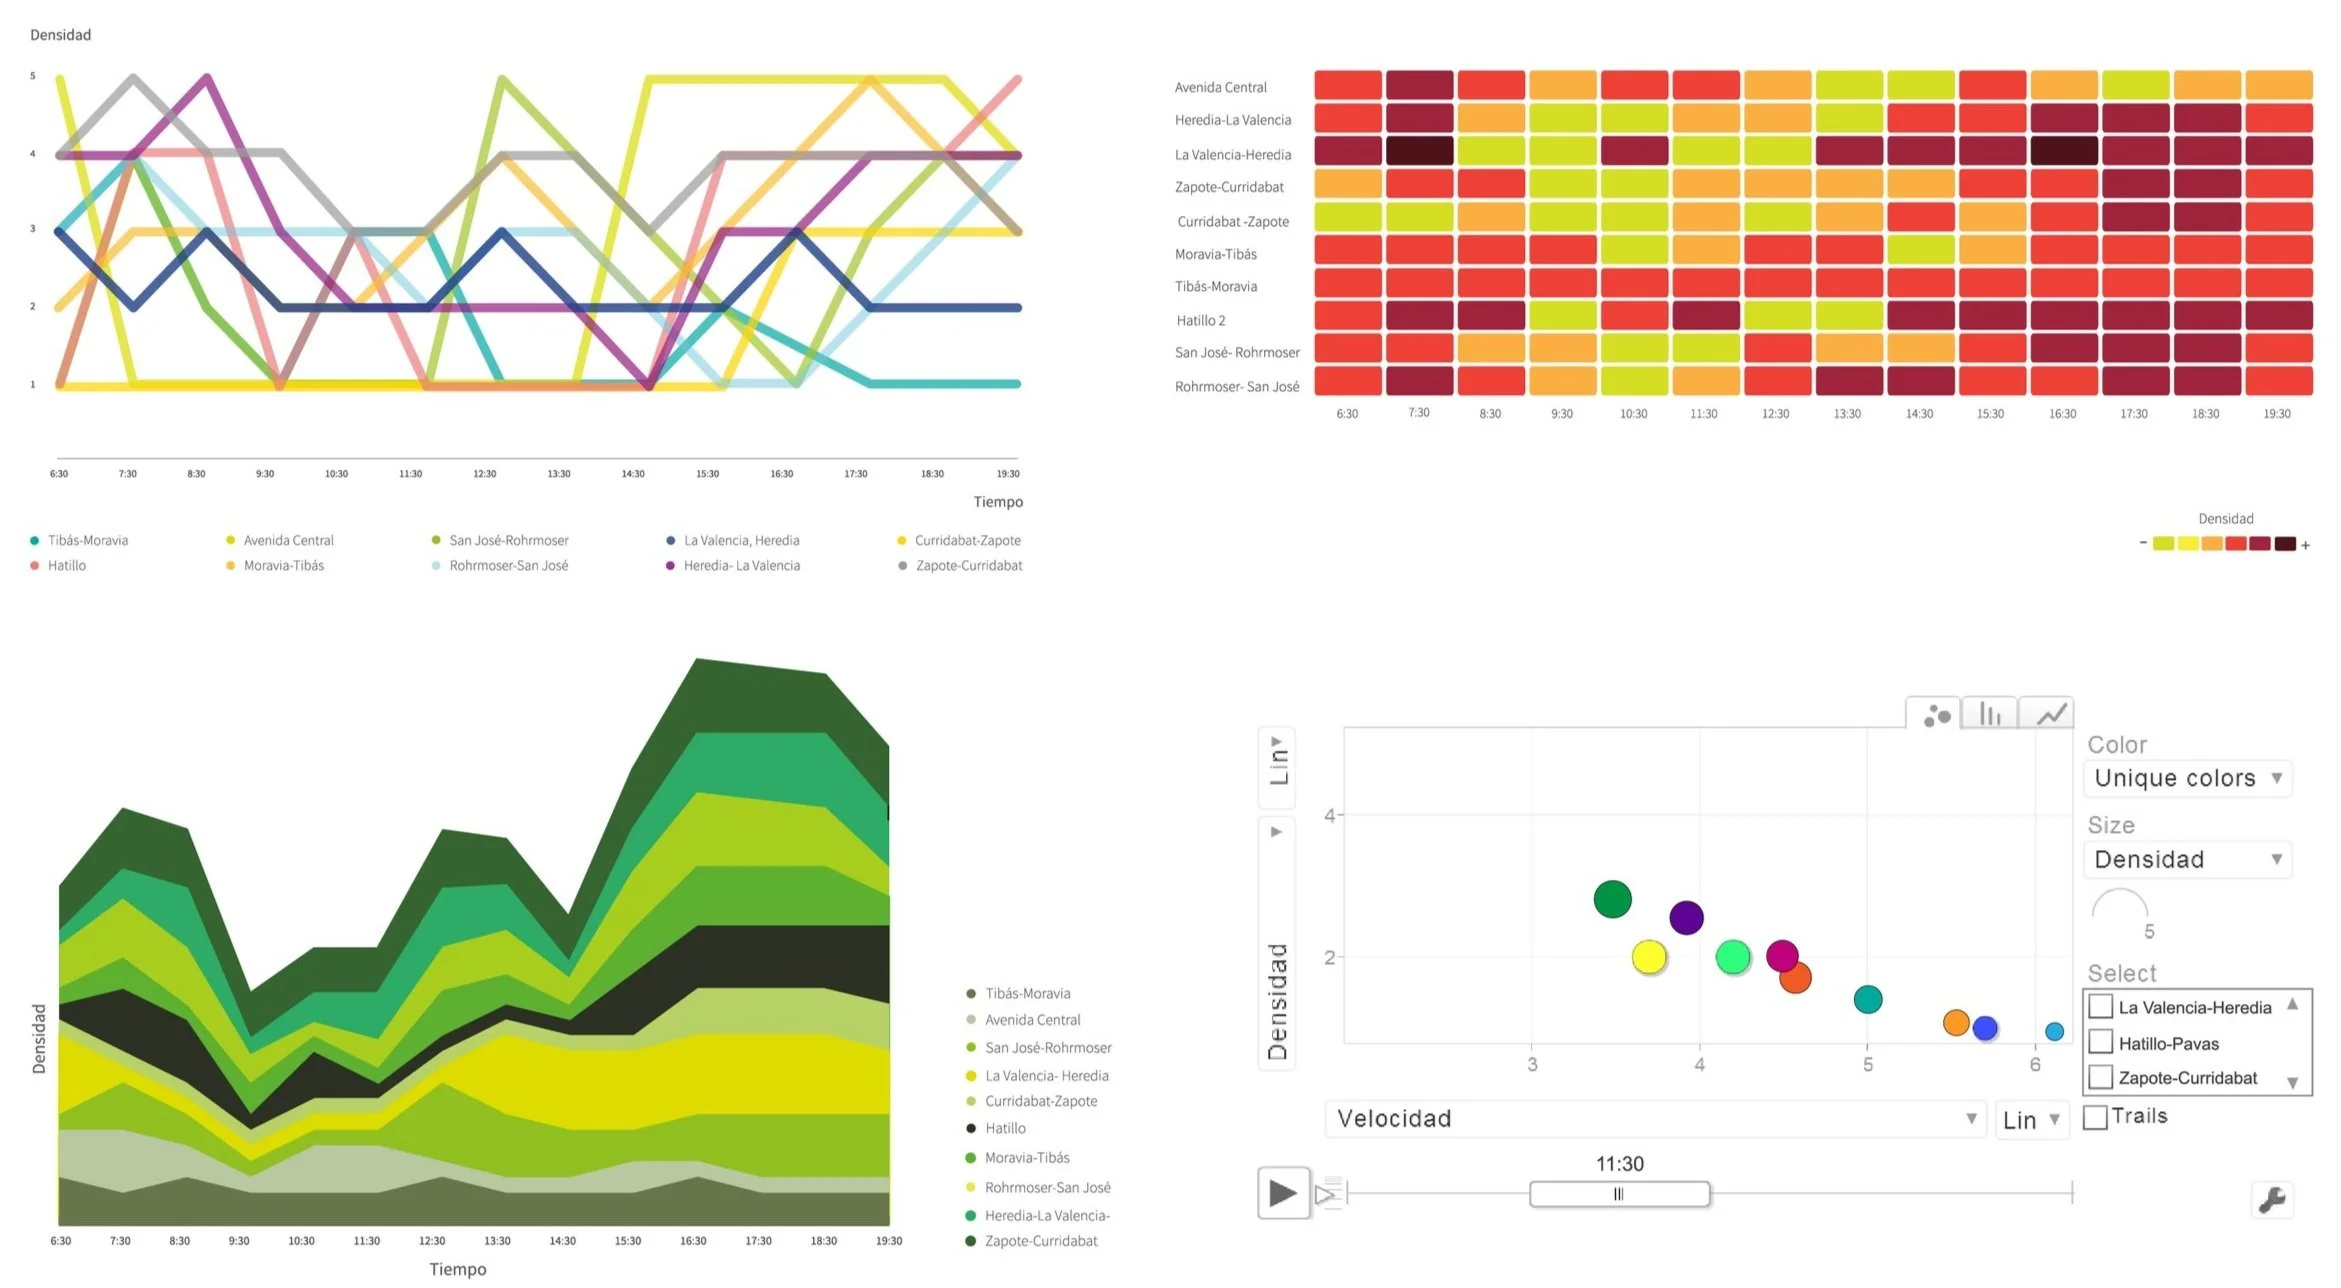
We gained access to the Connected Citizens database and started exploring potential ways to visualize the data. To identify the best visualization approach for our tool, we concentrated on time-based data visualization options. We created a quick data mockup to evaluate four different methods: Heat Map, Bump Chart, Streamgraph, and Gapminder.
Evaluating the options
1) Utilized usability criteria that align with user requirements and usability heuristics, including ease of reading and use, facilitating analysis, intuitiveness, manageable learning curves, efficiency, and support for comparisons.

2) Tested customized case studies
Analyzing a route section's highest and lowest density during one day.
Comparing the densities of two sections throughout one day.
Identify the days and hours with the least dense traffic over a week.
Finding the Friday with the highest density of traffic in the month.

The HeatMap received the highest scores and best feedback in both evaluations, so we decided to proceed with this visualization.
Design
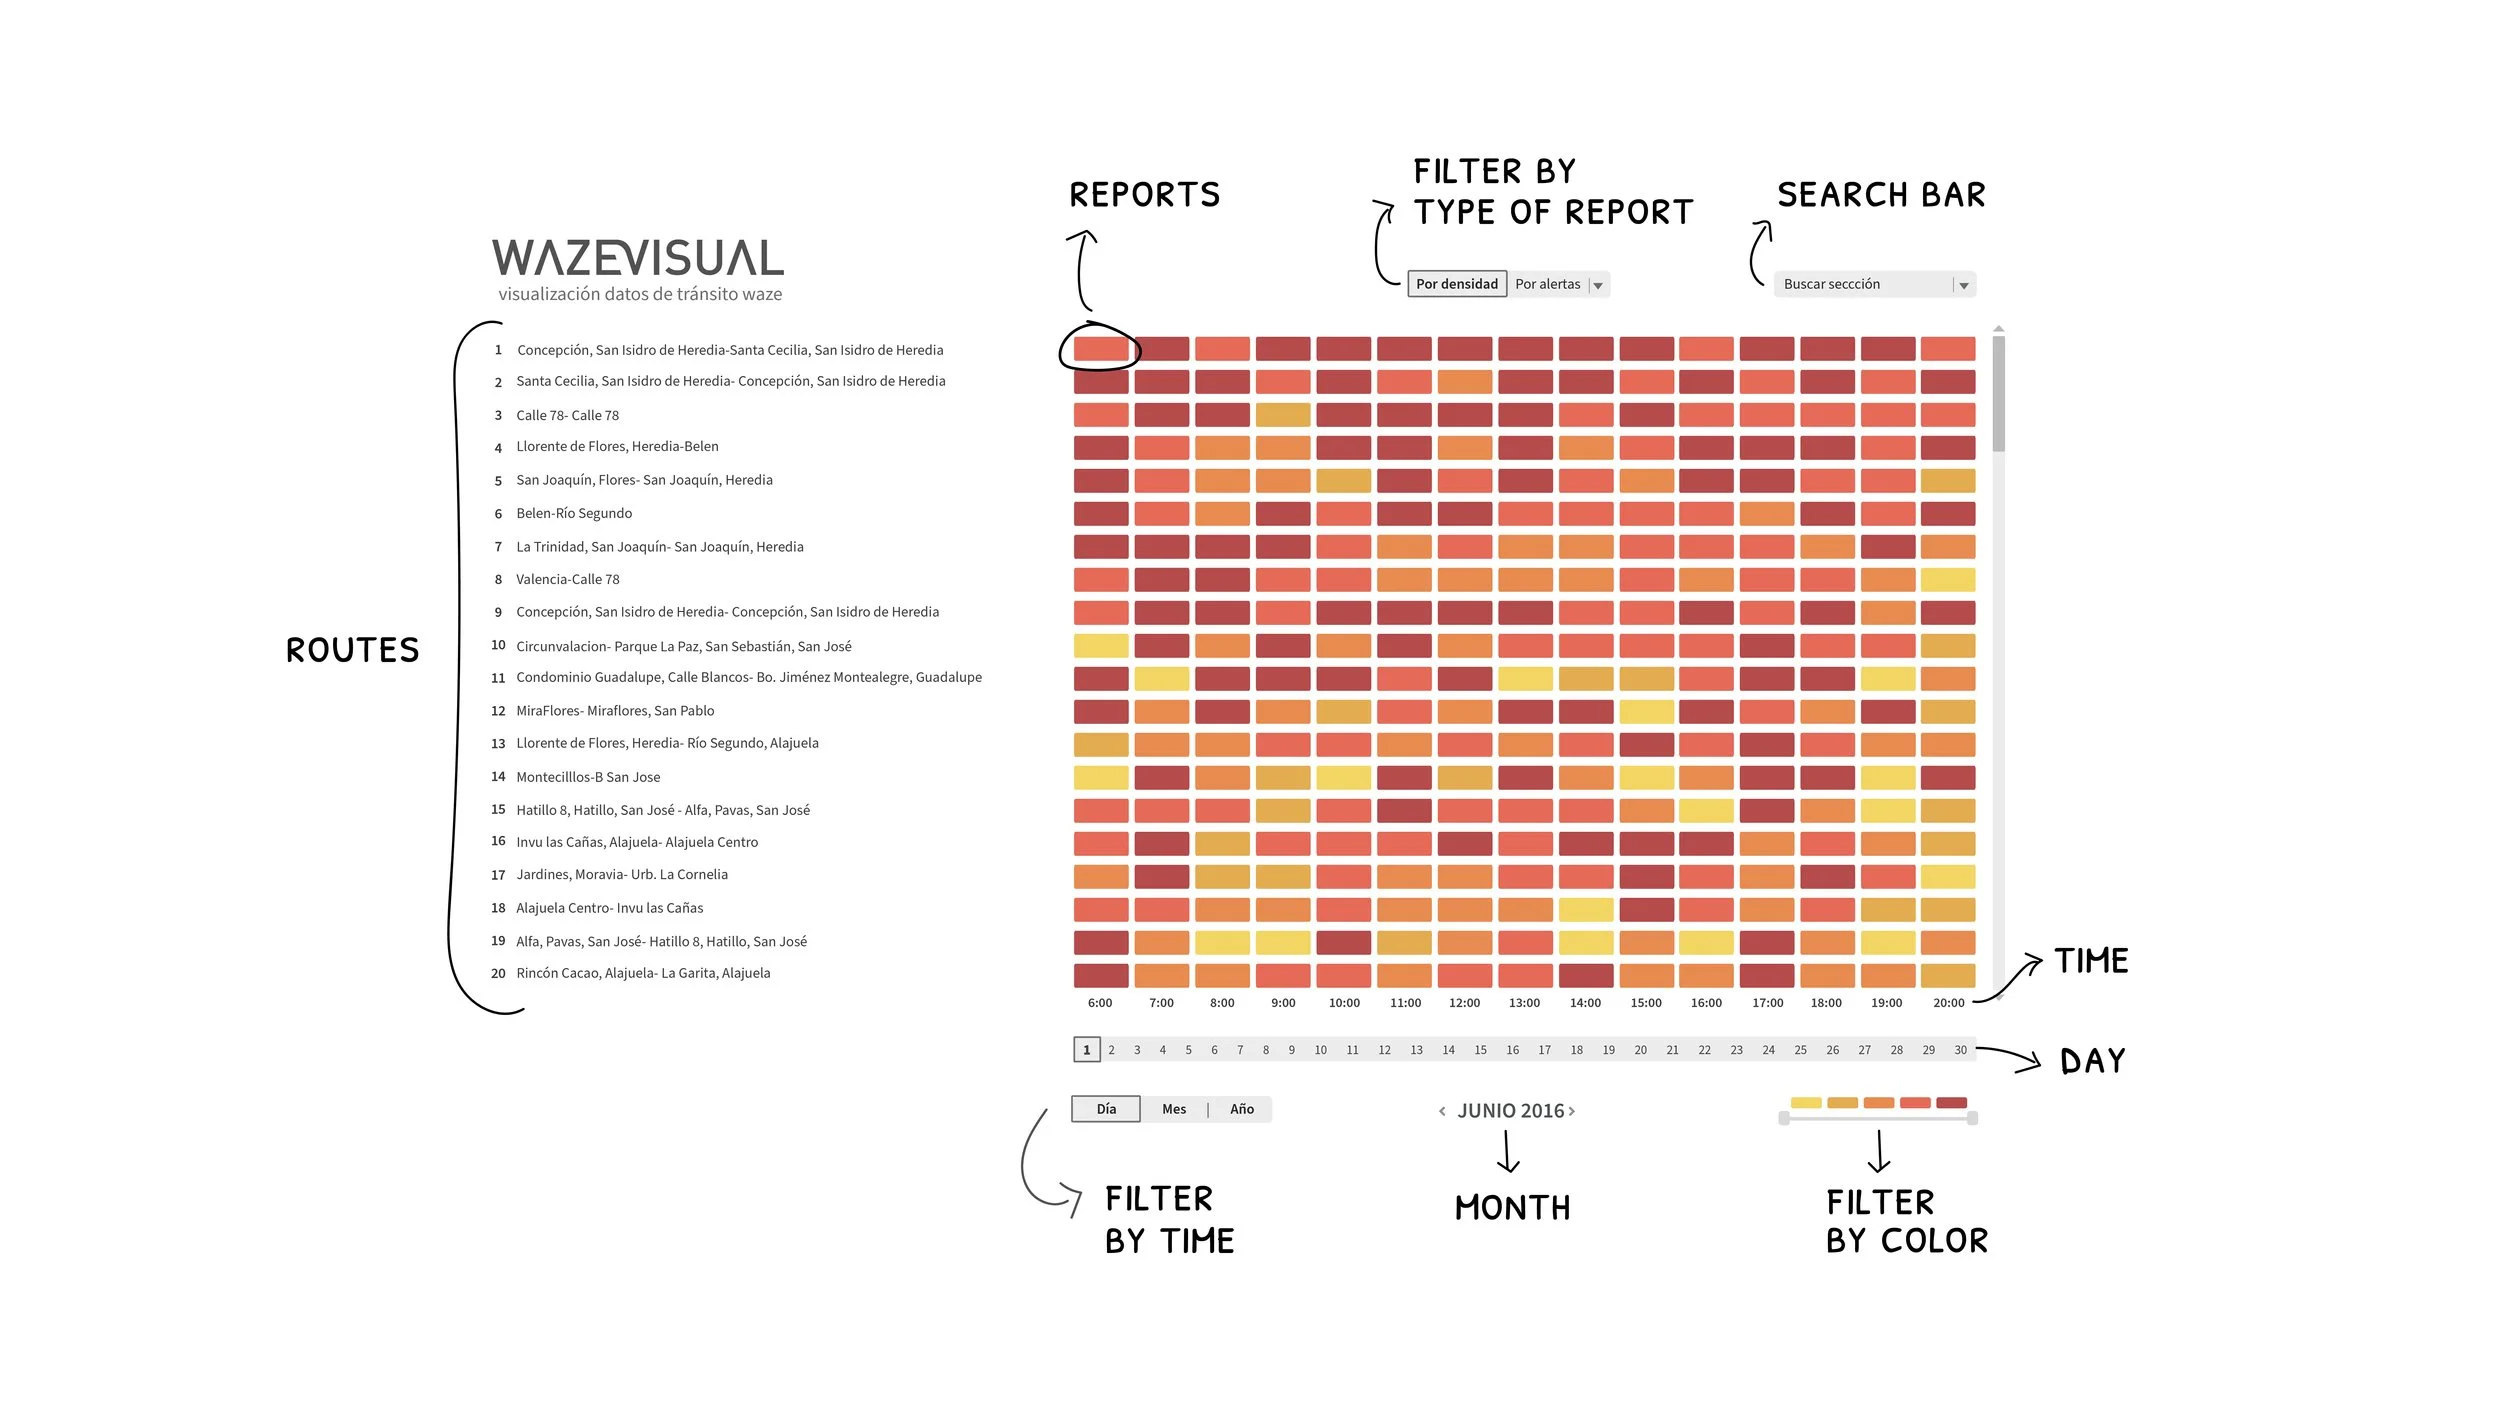
We began by drafting wireframes based on users' requirements, which we translated into the following functionalities: selecting sections, selecting hours, filtering by color range, dragging sections, and searching by section name.

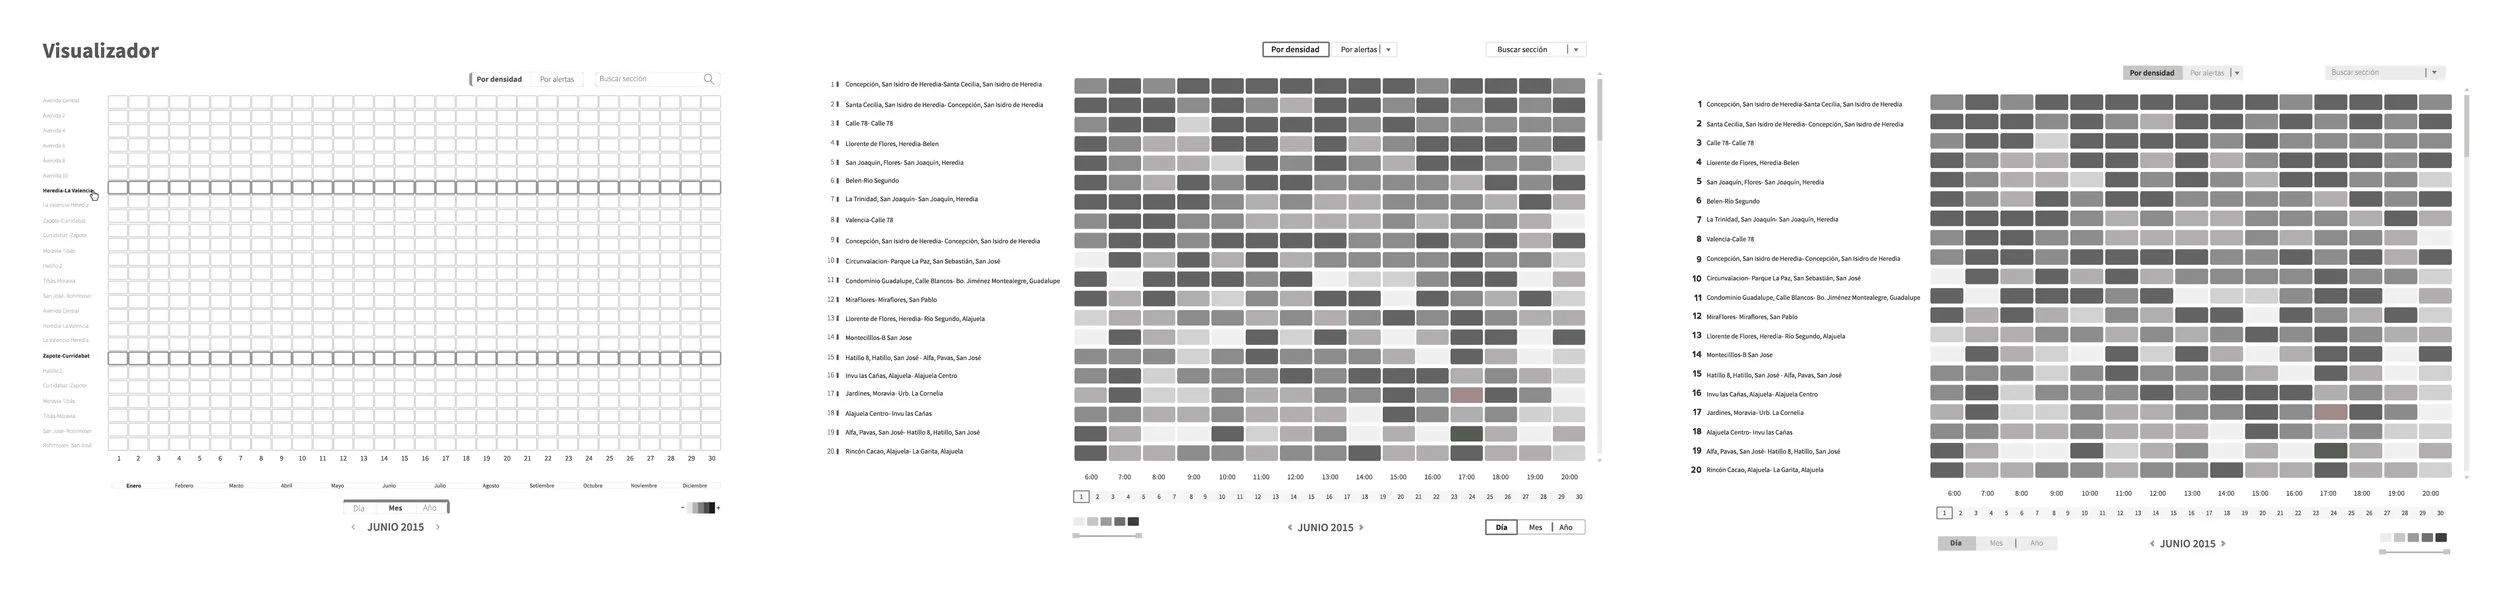
We also experimented with various color palettes to indicate traffic conditions based on density. The colors represent congestion levels, with different shades of red signifying the highest density and other shades of green indicating the lowest density.

After numerous color iterations, the team selected a color palette, considering that it should be pleasant for users who would spend a lot of time using the tool. At this point, we decided to move forward and implement a functional prototype using Javascript and a sample of one month's data from the SQL database.

Outcomes
WazeVisual is a platform that visualizes data for the top 100 routes with the highest traffic congestion and density. It offers several functionalities that allow users to highlight multiple routes by either route or time. Routes can be arranged side by side for easy comparison. A color filter is available to visualize layers of density separately. Additionally, users can select a specific day of interest or different hours for a more detailed analysis.